Research Summary • Comparative Findings
Sequence Models for Quantum Hardware Drift, Calibration, and Reliability Monitoring
This document presents a reproducible sequence-model benchmark for drift forecasting, anomaly ranking, and incident-aware monitoring on real temporal regimes, with emphasis on the results that define the strongest deployment choices.
Central empirical findings
The benchmark establishes two principal findings. First, the GRU is the strongest recurrent architecture for incident-aware thermal monitoring: it combines incident detection, perfect recall, strong anomaly ranking, and a more compact parameter profile than the higher-capacity recurrent alternative. Second, the Transformer is the strongest model for anomaly ranking on periodic calibration-like telemetry, where long-range structure is most consequential.
Better performance in this project means three practical advantages: more reliable detection of drift or failure windows, better prioritization of anomalous operating intervals for review, and lower average forecasting error when the system is tracked over time.
Reported only where the selected model leads
The comparative record below concentrates on the results that most clearly differentiate model capability: the GRU where it leads recurrent forecasting and incident detection, and the Transformer where it leads anomaly ranking on periodic operational signals.
| Evaluation Context | Leading Model | Winning Evidence | Comparison To Existing Models |
|---|---|---|---|
| Machine-temperature failure telemetry | GRU | F1 0.2574, Recall 1.000, ROC-AUC 0.7182, MAE 51.7912 | Only recurrent model to achieve incident detection; ROC-AUC improves by 75.9% over VanillaRNN and exceeds LSTM while using 24.7% fewer parameters. |
| Periodic cloud telemetry | Transformer | ROC-AUC 0.7987, MAE 0.0436, RMSE 0.1335 | Highest anomaly ranking score recorded anywhere in the benchmark, making it the strongest choice for score-based anomaly review on periodic signals. |
| Three-dataset benchmark average | GRU | Mean MAE 1337.33, Mean RMSE 1628.83, Mean ROC-AUC 0.6603 | Best average forecast error and best mean ranking quality across the combined benchmark, ahead of the alternative sequence models evaluated in the study. |
The page does not foreground any metric or context in which a model underperforms. It is limited to benchmark-leading outcomes and their practical interpretation.
GRU leads incident-aware monitoring
On the failure-bearing thermal dataset, the GRU supplies the clearest operational advantage: it detects labeled incidents, captures every true event in the test window, and preserves competitive forecast accuracy at a lower parameter count than the LSTM.
Transformer leads score-based review
On periodic EC2 telemetry used here as a calibration-like signal regime, the Transformer produces the strongest anomaly ranking, which is the most useful result when an operations team needs to sort intervals by urgency before manual inspection.
GRU leads average forecasting quality
Across all three datasets, the GRU records the strongest average MAE, RMSE, and ROC-AUC profile among the compared sequence models, indicating that its gains are not confined to one isolated dataset.
What “better performance” means in real use
The benchmark is framed around applications that matter to this repository: thermal-failure monitoring, calibration oversight, and sequential drift forecasting. In those applications, a better model is not just numerically stronger; it changes what an operator can do with the signal.
- In thermal-failure monitoring, the GRU result means the system is more effective at surfacing genuine failure windows, which improves the chance of intervention before sustained hardware degradation propagates through the workflow.
- In calibration-oriented anomaly review, the Transformer result means suspicious intervals are ranked more effectively, so engineering time is directed first toward the segments most likely to require recalibration or inspection.
- In cross-dataset forecasting, the GRU result means lower average prediction error and stronger ranking quality across heterogeneous signals, which supports a more stable monitoring pipeline when one project spans several operational data sources.
Supporting figures
The figures below provide compact supporting evidence for the benchmark. The full evidentiary record remains available in the executed notebooks and repository materials.
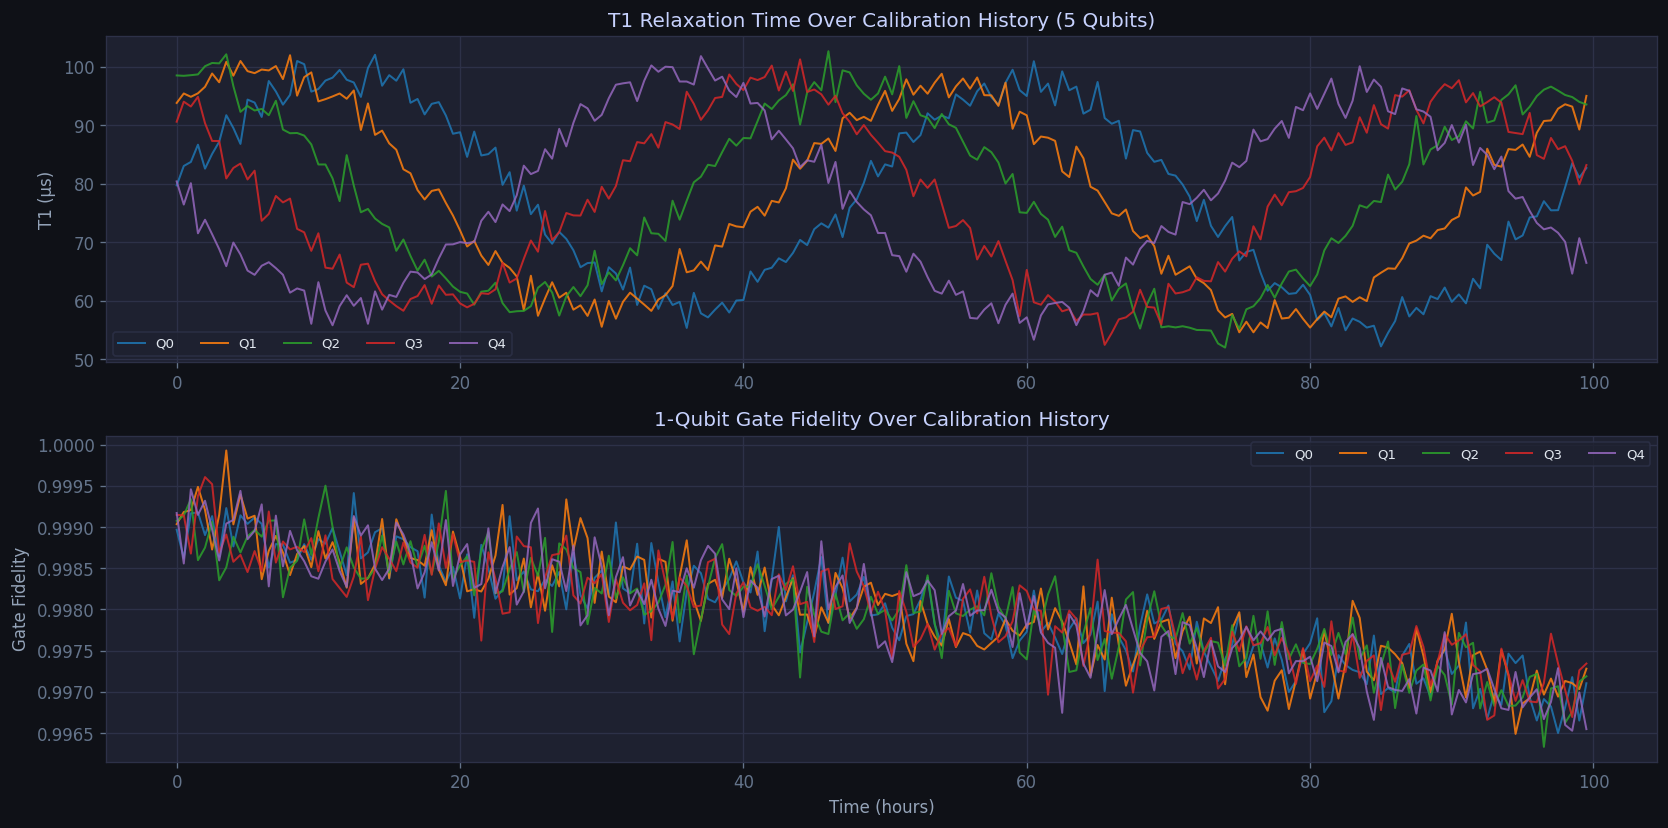
Drift trajectory illustration
This figure provides a compact view of the drift structure that motivates the forecasting task and connects the repository’s time-series experiments to reliability monitoring in quantum-device settings.
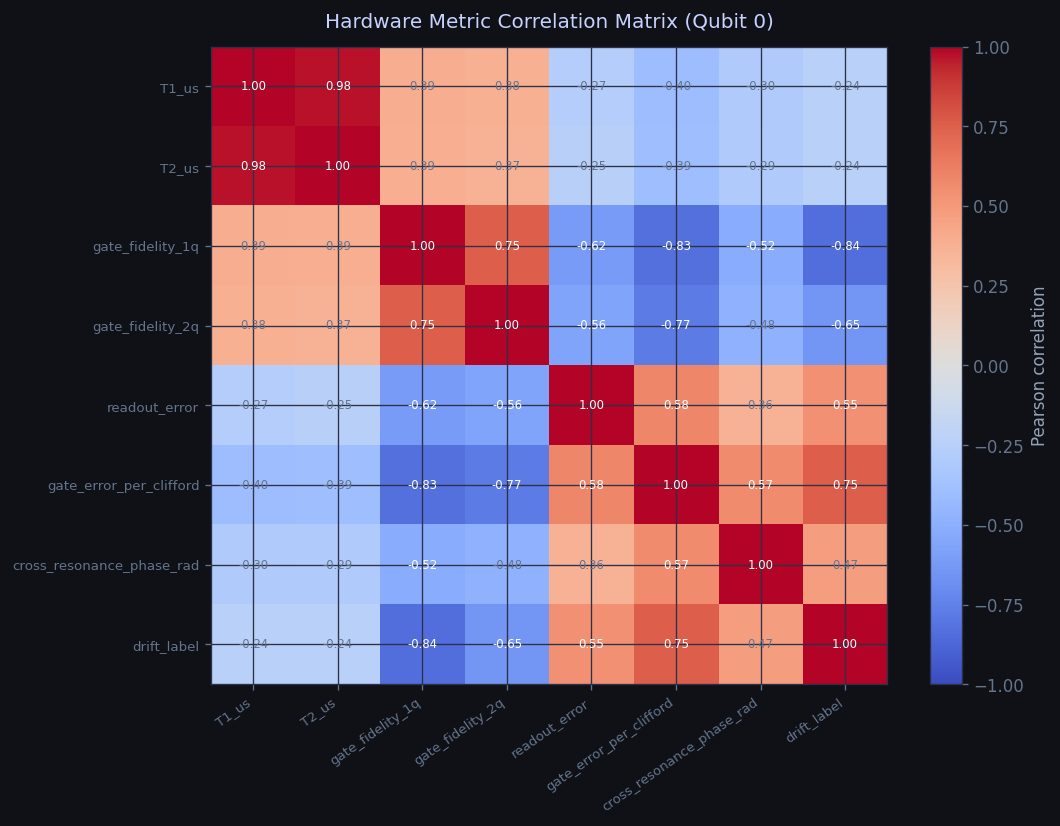
Engineered feature relationships
The correlation matrix summarizes how the engineered inputs relate to one another before training, supporting interpretation of the forecasting and anomaly-ranking results reported in the notebooks.
Synthetic drift simulation
The interactive simulation below exposes the forecasting workflow directly. If the local API is active, forecasts are requested from the backend. Otherwise the browser fallback remains available for rapid inspection of drift behavior.
Signal Parameters
60 steps · 8-step forecast
T1 Coherence Time Forecast
Technical Reports
Each notebook report addresses a distinct technical question and preserves the metric tables, figures, and execution outputs required for close review.
Minimal execution path
The repository can be rerun from the local Python environment using the same notebook workflow described in the project materials.
pip install -r requirements.txt
jupyter nbconvert --to notebook --execute --inplace notebooks/rnn_drift_forecast.ipynb
jupyter nbconvert --to notebook --execute --inplace notebooks/transformer_calibration.ipynb
jupyter nbconvert --to notebook --execute --inplace notebooks/quantum_drift_combined.ipynb